Summer 2016 Internship Report
Between April and August 2016, I was an intern for the CRAQ (Centre de recherche en astrophysique du Québec) under the supervision of prof. Pierre Bergeron, at the Université de Montréal. I was working on developping a complete, statistically unbiased, volume-based sample of white-dwarf stars within a distance of 40pc of the sun, visible from the northern emisphere, as well as obtaining important physical properties for these stars, such as effective temperature, surface gravity (log g) and atmospheric composition.
The spectroscopic and photometric data used was mainly collected by Marie-Michele Limoges, PhD, who left the CRAQ after obtaining her diploma. She published a paper on the subject with Bergeron and prof. Sebastien Lepine from Georgia State University, available here. The goal of my internship was to re-do the analysis of the whole sample using new atmospheric models for various spectral types of white dwarf stars and to clarify the codes and to make them more homogeneous and reusable.
White dwarf stars represent the last stage of the life of 97% of the stars of our Galaxy, including the Sun. The sample used is from the SUPERBLINK survey, a vast catalog containing proper motion data and photometric data of more than 2 million stars. White dwarf stars are stars having masses from about 0.4 to 1.4 times the mass of the sun. However, this type of star has a size comparable to the size of the earth, which means it is much more dense than the Sun. In fact, the physics behind this type of star is pretty different from the one of a normal, main sequence star. For a main sequence star such as the Sun, the force that stops the star from collapsing onto itself because of its own gravity is the pressure created by nuclear reactions in its core. A white dwarf star has no more nuclear reaction going on in its core, so it collapses onto itself, but that process is stopped by the pressure of the degenerate electrons of the core, which are governed by the Pauli exclusion principle, which states that fermions (the electrons in our case) cannot occupy the same quantum state, which limits the minimum volume of the star. The white dwarf star is then left in outer space, without doing anything except from cooling, for the rest of eternity.
I used two different methods to determine the atmospheric parameters of the various white dwarf stars. The first method used was the photometric method, which consists on using various photometric filters and to fit the temperature. This method has a flaw, because unless we have a trigonometric parallax measurement for the star, we have no choice but assume the log g of the star being 8.0 to fit the temperature photometrically. If we do have a trigonometric parallax measurement, we can fit both the effective temperature and the surface gravity of the white dwarf star. An example of a fit is demonstrated on a typical DA star, which is a white dwarf star showing hydrogen features only.
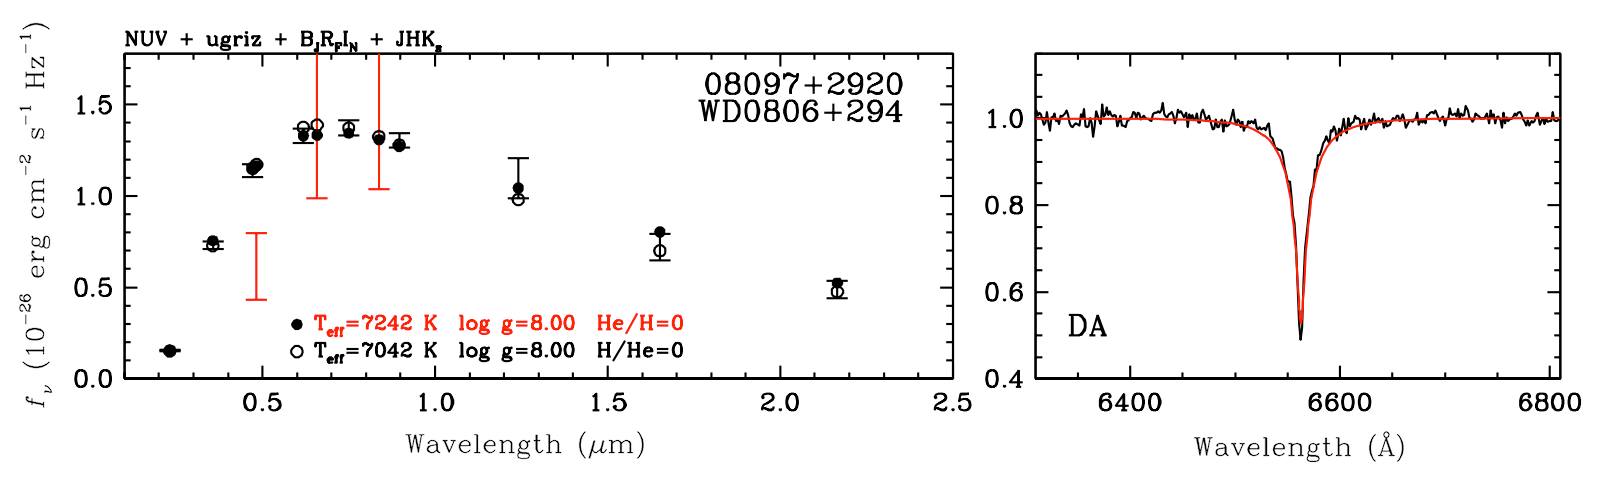
We can easily see the log g problem on this figure, where the fit stays at 8.00. This star is an already known white dwarf star. The left panel shows the photometric data from various filters (Galex (near UV), UGRIZ, USNO (Bj, Rf and In) and 2mass (J, H and Ks)) and the and the appropriate fit for a hydrogen atmosphere (black circles) as well as an helium atmosphere (white circles). The filters highlighted in red are excluded from the fit and the atmospheric parameters highlighted in red correspond to the chosen solution. The right panel presents a normalised spectrum of the Hα Balmer Line with the red curve representing the fit for the predicted temperature and surface gravity.
The other method used to find the physical parameters of a star is the so-called spectroscopic method. For this method, we use the spectrum of a star and we fit the log g and effective temperature using atmospheric models (a technique which was developped at the Université de Montréal). An example of a fit using the spectroscopic method is shown here on the same star as above.
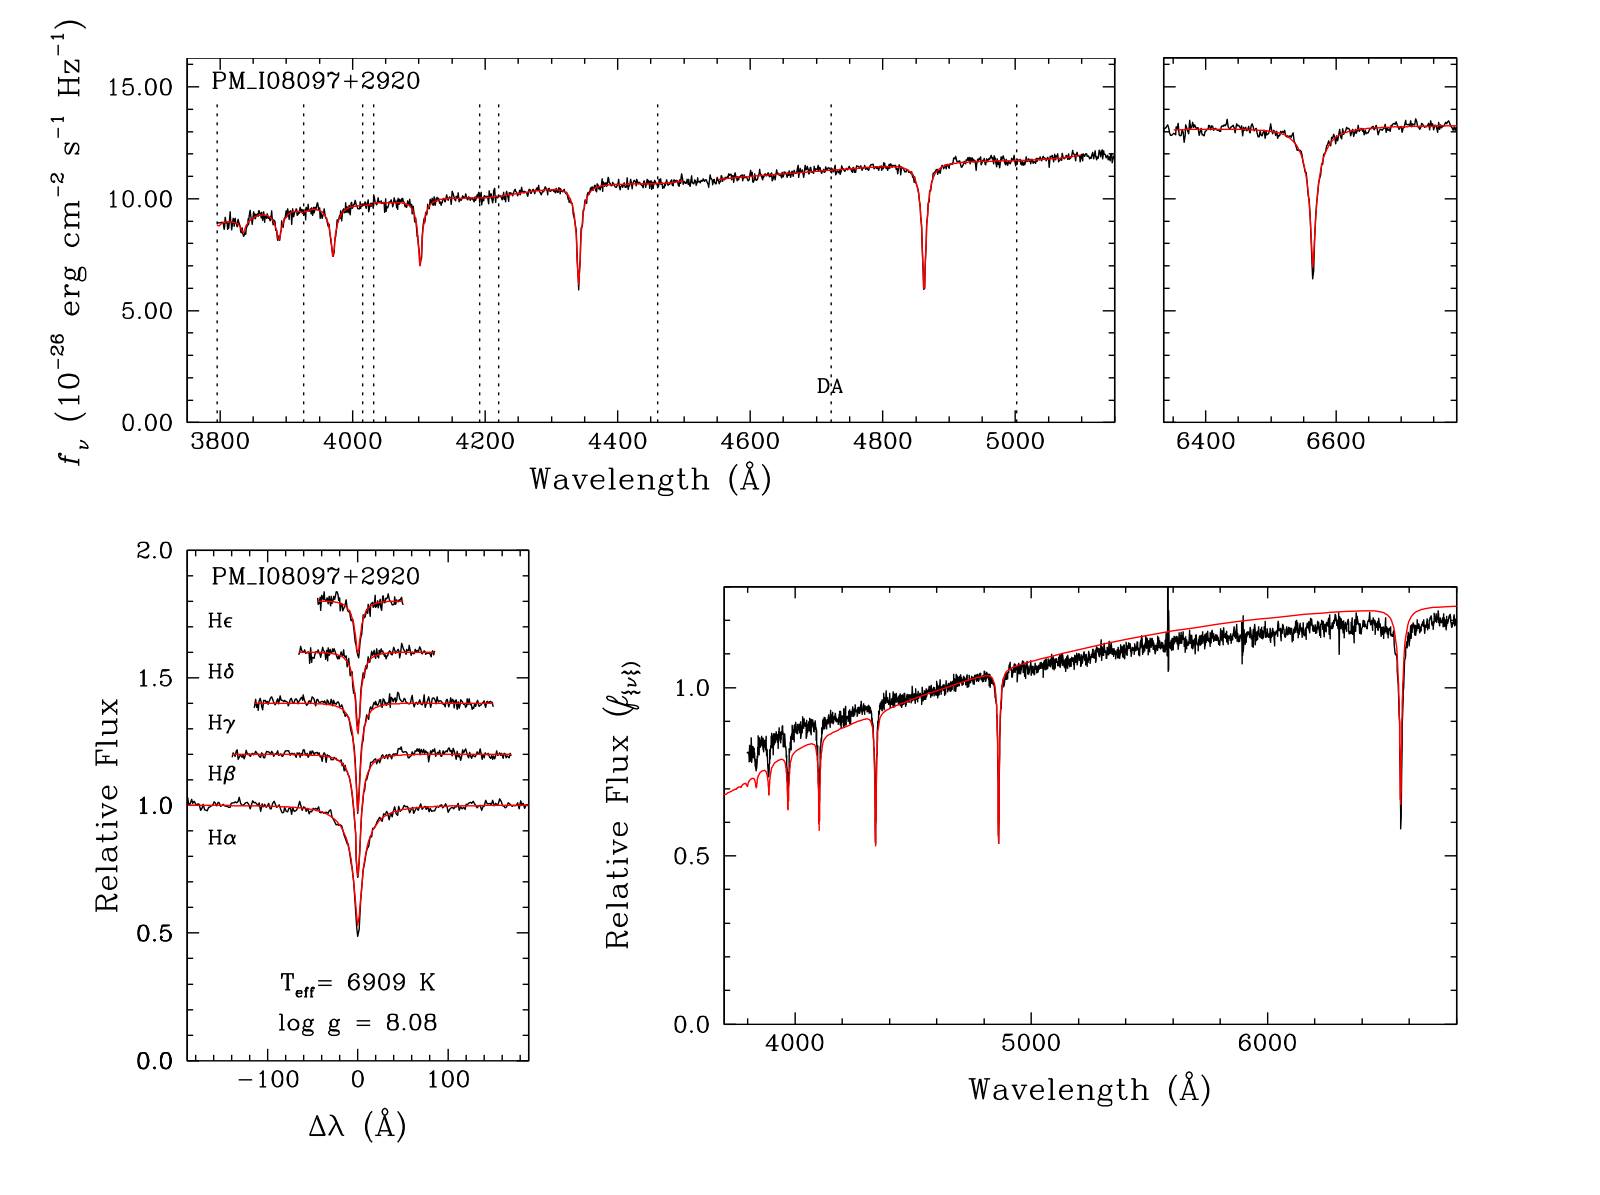
The top two panel presents the spectrum of the star. The bottom left panel shows the Balmer lines Hα to Hε from the spectrum onto which we have calculated fits to extract the effective temperature and the surface gravity. As you can see, the log g is clearly different from the other figure, since we couldn’t fit this parameter with the other method. The bottom right panel shows only the normalised spectrum of the star and is not that important.
After obtaining these parameters, we can use a similar algorithm as used for the photometric method to find the distance and the mass of the star.
DB stars, which show helium features, and DAZ stars, which show hydrogen features and metallic features as well, are fitted using the same techniques as described above. However, some type of white dwarf stars, such as DQ stars (carbon features) and DZ stars (metallic features) need to be fitted using a combination of both techniques.